Venue Flow Patterns: How Interior Designs Steer Selections at Approved Regional Wagering Sites
Written by Blake Vogel · May 26, 2026
Venue Flow Patterns: How Interior Designs Steer Selections at Approved Regional Wagering Sites
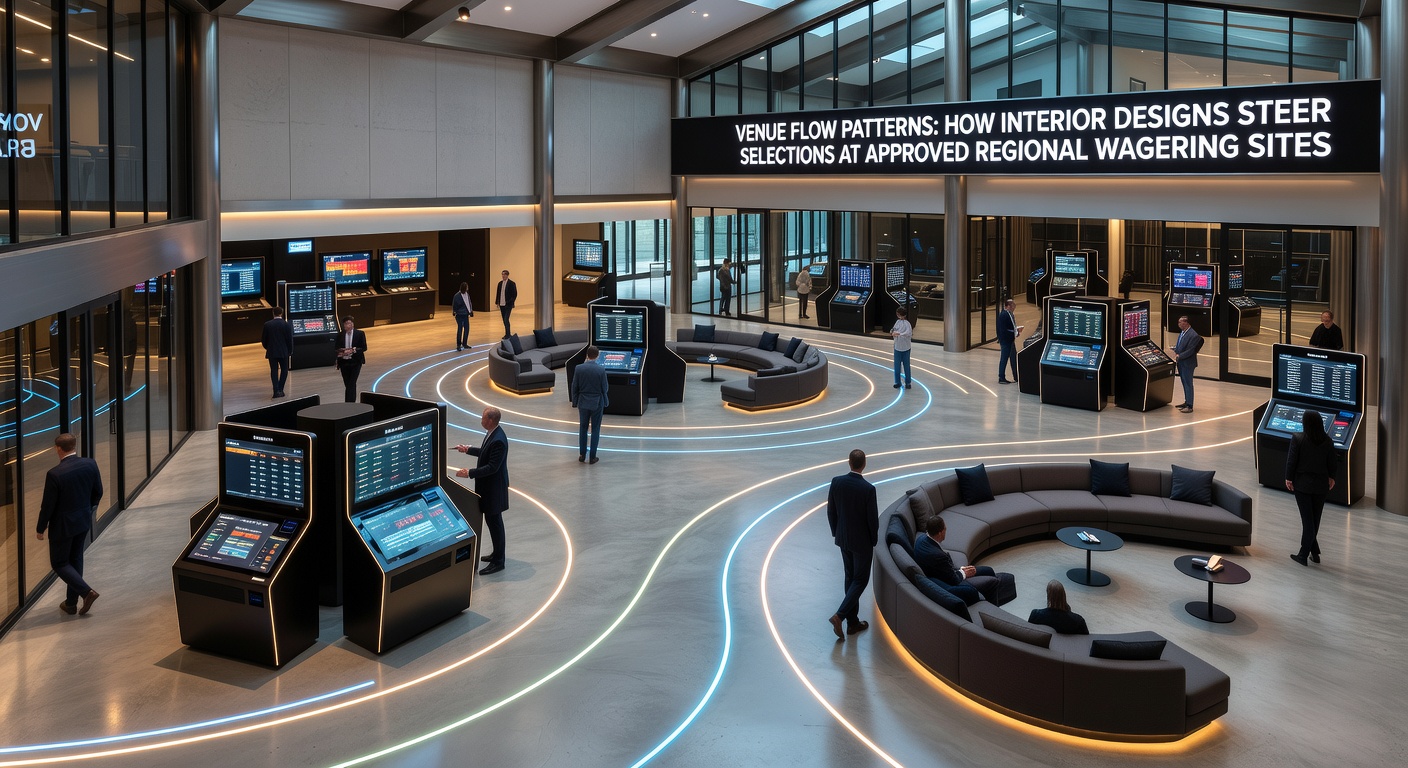
Approved regional wagering sites across multiple states have adopted interior designs that shape how bettors navigate spaces and select wagers, with flow patterns emerging as a key factor in placement decisions. Data from regulatory filings in 2025 and early 2026 show that terminal positioning along primary pathways correlates with higher volumes on specific event types, particularly live betting options that now account for over 62 percent of online revenue in tracked markets.
Design teams coordinate with operators to map foot traffic using sensors and heat maps, which reveal that curved entry routes increase dwell time near digital kiosks by directing visitors past promotional displays first. Those patterns appear in venues operating under licenses from state bodies such as the New Jersey Division of Gaming Enforcement, where quarterly reports document measurable shifts in handle when seating clusters sit adjacent to high-traffic corridors rather than in isolated corners.
Pathway Architecture and Selection Bias
Linear aisles versus looped configurations produce different outcomes in bettor behavior, according to layout analyses conducted at licensed facilities in Pennsylvania and Colorado. Straight corridors funnel patrons quickly toward central betting walls, elevating selections for major league pre-game markets, while looped designs encourage repeated passes that boost engagement with niche prop bets and in-play adjustments. Observers note that these effects intensify during peak evening hours when crowd density rises and visual cues such as illuminated signage pull attention toward specific screens.
Lighting gradients further reinforce movement, with brighter zones near entry points transitioning to softer illumination around lounge seating that operators reserve for extended sessions. Research from the University of Nevada, Las Vegas Center for Gaming Research indicates that such transitions extend average visit duration by measurable margins when combined with clear sightlines to multiple wagering interfaces.
Terminal Placement and Regional Variations
Placement density around sportsbooks varies by jurisdiction, yet consistent patterns emerge in how proximity to restrooms, bars, and exits influences category choices. Terminals clustered near beverage stations record elevated activity on shorter-duration wagers, while those positioned farther from amenities attract longer-form accumulators. In May 2026, several Midwest venues reported updated configurations that repositioned self-service kiosks along primary flow lines, aligning with seasonal upticks in baseball and basketball handle.
State-level oversight ensures these adjustments remain within approved parameters, with operators submitting revised floor plans that demonstrate compliance with accessibility and traffic standards. Figures from the Colorado Limited Gaming Control Commission, for instance, track how such modifications affect overall revenue distribution across machine types without altering total handle.
Signage, Technology Integration, and Behavioral Data
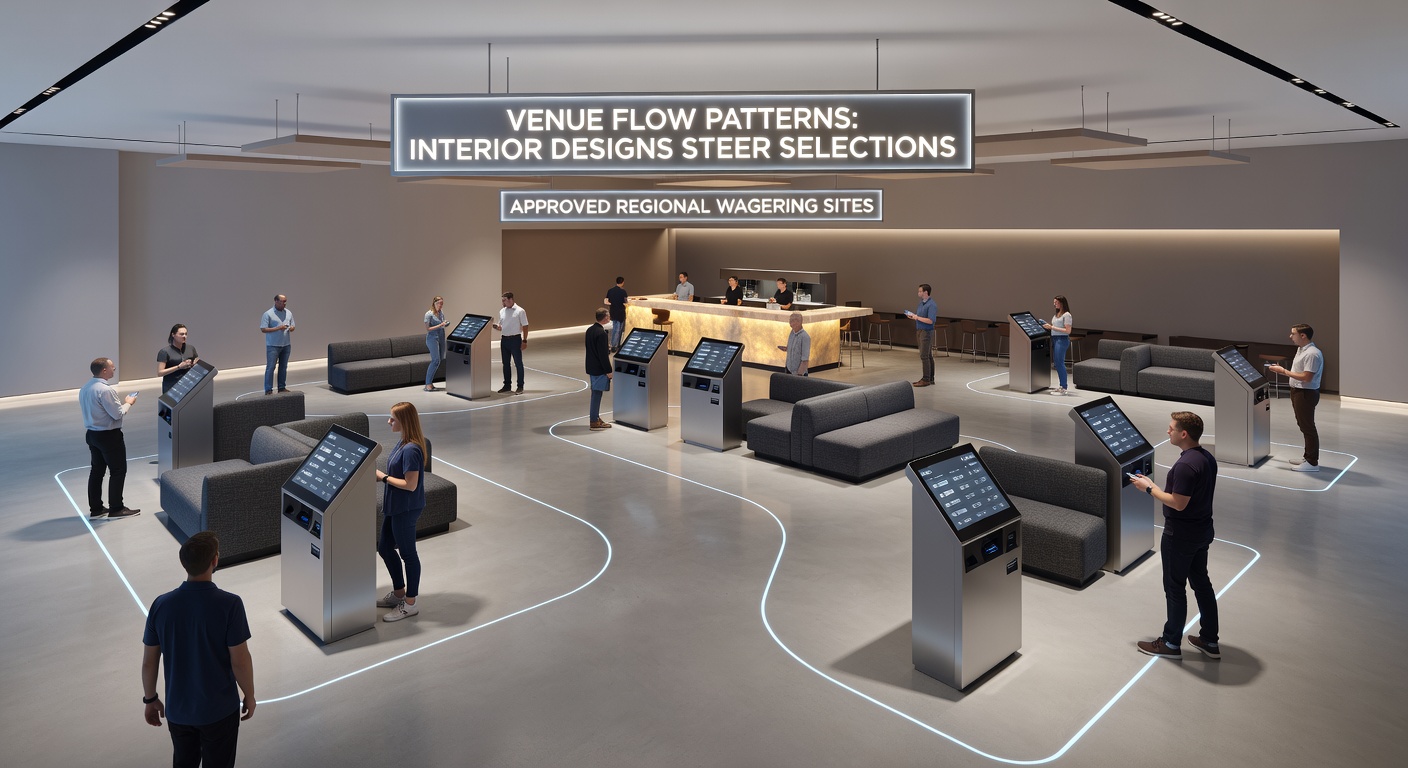
Digital wayfinding systems integrated into modern interiors provide real-time prompts that steer selections toward events with current promotional incentives. These systems connect to central odds engines, allowing operators to highlight markets experiencing lower volume and redistribute traffic accordingly. Studies tracking user interactions show that dynamic signage increases cross-category selections by guiding patrons through multiple zones rather than allowing direct routes to preferred terminals.
Acoustic design elements, including zoned soundscapes, complement visual cues by reducing ambient noise near high-stakes areas and maintaining energy levels in high-traffic betting pits. Such layered approaches appear in newly opened facilities that opened after 2024 regulatory expansions, where architects collaborated with gaming consultants to model expected movement before final construction.
Regulatory Context and Measurement Standards
Approved sites must document design impacts during license renewals, providing traffic studies that state regulators review for fairness and operational efficiency. These submissions often reference anonymized transaction logs that correlate layout changes with shifts in bet distribution across sports and wager types. The approach mirrors reporting requirements in other jurisdictions, including those managed by the Alcohol and Gaming Commission of Ontario, which emphasize transparent data on how physical environments affect player choices.
Operators continue to refine these elements as prediction markets expand into additional states, with early 2026 filings indicating increased attention to modular furniture that allows rapid reconfiguration ahead of major tournaments. The adjustments support both regulatory compliance and alignment with evolving bettor preferences documented in industry-wide statistics.
Conclusion
Interior flow patterns at approved regional wagering sites function as measurable variables that influence wager selections through coordinated layout, lighting, signage, and technology placement. Regulatory data collected through 2026 confirm that these design choices produce consistent effects across different state markets, guiding operators toward evidence-based configurations that balance revenue goals with compliance standards. As venues adapt to new event calendars and market expansions, ongoing analysis of movement metrics remains central to maintaining efficient operations.