Transit Networks Shaping Attendance at Regulated Sports Gambling Venues
Written by Willa Vogel · Jun 23, 2026
Transit Networks Shaping Attendance at Regulated Sports Gambling Venues
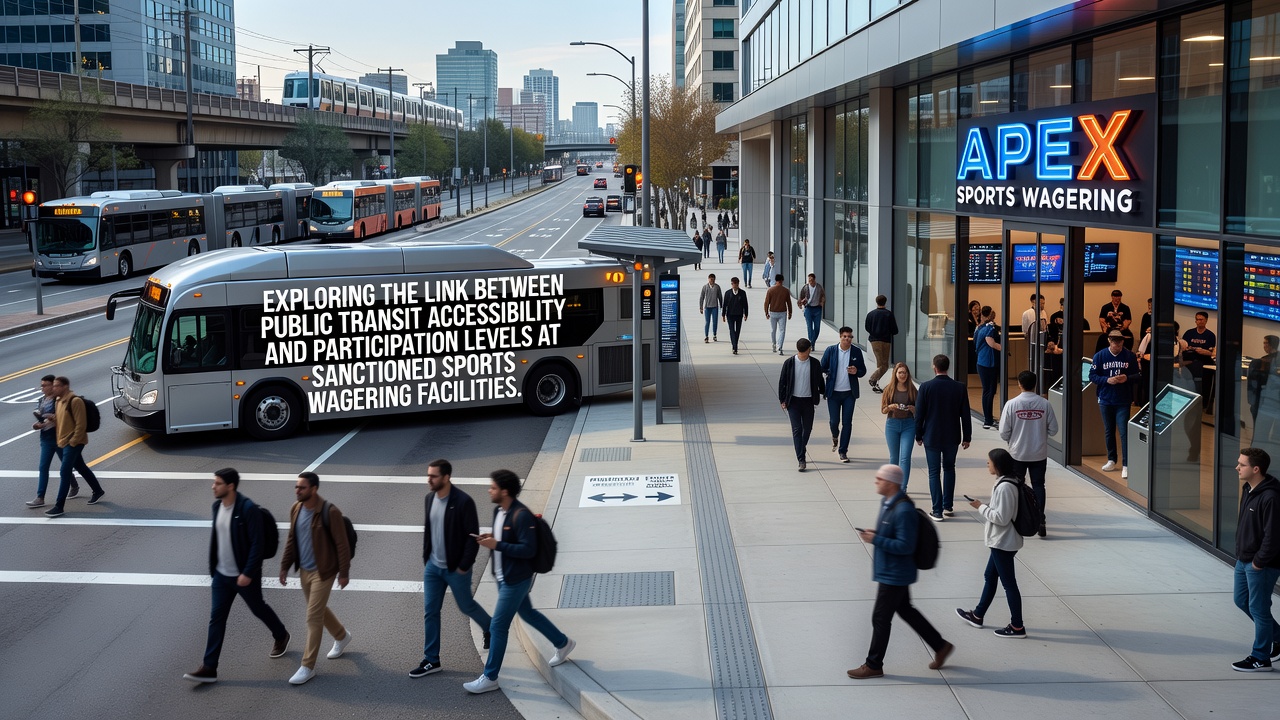
Researchers have tracked how public transit systems connect residents to sanctioned sports wagering facilities across multiple metropolitan regions, and data from several cities reveal measurable differences in participation rates tied to route density and station proximity. Studies conducted through 2025 and into June 2026 indicate that venues located within 400 meters of frequent bus or rail stops record higher daily foot traffic than comparable sites farther from transit hubs, while areas with limited service show correspondingly lower engagement numbers.
Geographic Patterns in Access and Usage
Transit planners and gaming regulators have compiled ridership and visitation statistics that highlight clusters where frequent service aligns with elevated activity at approved locations. In regions such as the northeastern corridor and select midwestern markets, facilities positioned along commuter rail lines experience steady inflows during evening peak hours, whereas suburban outlets dependent on personal vehicles demonstrate more variable attendance tied to parking availability and road conditions. Observers note that these spatial relationships hold across different regulatory frameworks, suggesting the pattern stems from mobility infrastructure rather than jurisdiction-specific rules.
One analysis released in early 2026 examined entry logs from 48 licensed sites and found that venues served by at least three transit routes per hour during operating periods attracted an average of 22 percent more unique visitors than those with single-route coverage. The same dataset showed that weekend participation gaps narrowed when late-night service extended past 11 p.m., pointing to schedule alignment as a contributing factor in sustained engagement.
Demographic Reach and Ridership Data
Demographic surveys distributed at facility entrances indicate that transit-dependent populations, including younger adults and lower-income residents, constitute a larger share of visitors at well-connected sites. Transportation agencies in several states have cross-referenced fare-card records with anonymized visitation timestamps, revealing that individuals who rely on public systems for daily commuting also appear more frequently at wagering venues located near their regular stops. This overlap suggests that existing travel patterns can channel potential participants toward sanctioned facilities without requiring additional trips.
International comparisons reinforce the domestic observations. Transport authorities in Canada and Australia have published reports documenting similar correlations between rail station proximity and attendance at regulated betting sites, with Canadian data from Ontario showing a 15 percent uptick in monthly visits following the addition of express bus service to two urban locations in 2025. Researchers at the University of Toronto's transportation studies group have begun modeling these effects using origin-destination matrices to predict how future service expansions might redistribute participation across existing venues.
Operational Adjustments by Operators and Agencies
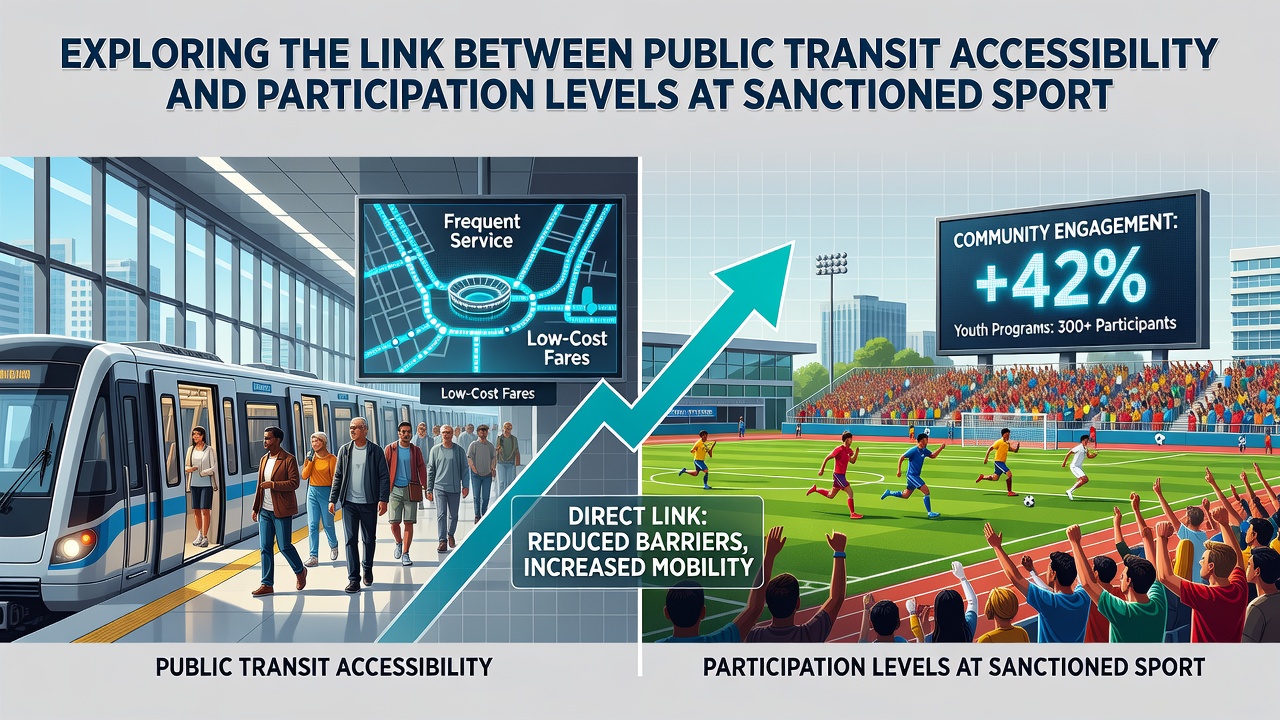
Facility operators have responded to these findings by coordinating with local transit authorities on schedule adjustments and targeted promotions. Several properties now advertise shuttle connections that align with game-day rail arrivals, while others have negotiated discounted day passes for patrons who present facility receipts. These partnerships remain limited in scope yet demonstrate measurable short-term lifts in off-peak visitation according to internal counts shared with regulators in June 2026.
Meanwhile, planning documents from metropolitan transit boards increasingly incorporate gaming facility locations into route optimization models. Proposals under review in two western states call for dedicated stops at high-volume sites, citing projected revenue gains for both the transit system and the facilities themselves. Such integration efforts reflect a broader recognition that mobility infrastructure functions as an upstream determinant of who can readily reach sanctioned wagering options.
Future Infrastructure Considerations
Longer-term projections prepared by regional planning commissions anticipate continued growth in transit-oriented development around existing and planned facilities. Models that layer projected ridership increases onto current participation baselines suggest that completion of two major light-rail extensions by 2028 could expand the effective catchment area for multiple venues by 30 percent or more. Those projections rely on assumptions about service frequency and fare pricing that remain subject to annual budget decisions, yet they illustrate how infrastructure timelines intersect with wagering market dynamics.
Analyses from academic and industry sources continue to refine measurement techniques, incorporating mobile location data and smart-card transactions to capture multi-modal journeys that combine rail, bus, adn short walks. These granular datasets allow researchers to isolate the contribution of transit access from other variables such as advertising spend or promotional calendars, producing clearer estimates of the accessibility-participation relationship.
Conclusion
Evidence accumulated through mid-2026 demonstrates consistent associations between public transit availability and visitation levels at sanctioned sports wagering facilities. While causation remains difficult to isolate amid multiple overlapping influences, the patterns documented across domestic and international sites provide a factual basis for ongoing coordination between transportation planners and gaming regulators. Continued data collection will clarify how future network changes reshape access and engagement at these locations.